 PolyField
 Analytics
Statistics
Useful insight for athletes, coaches and event organisers. Engage athletes and spectators with social media graphics, and plan future events with detailed competition metrics.
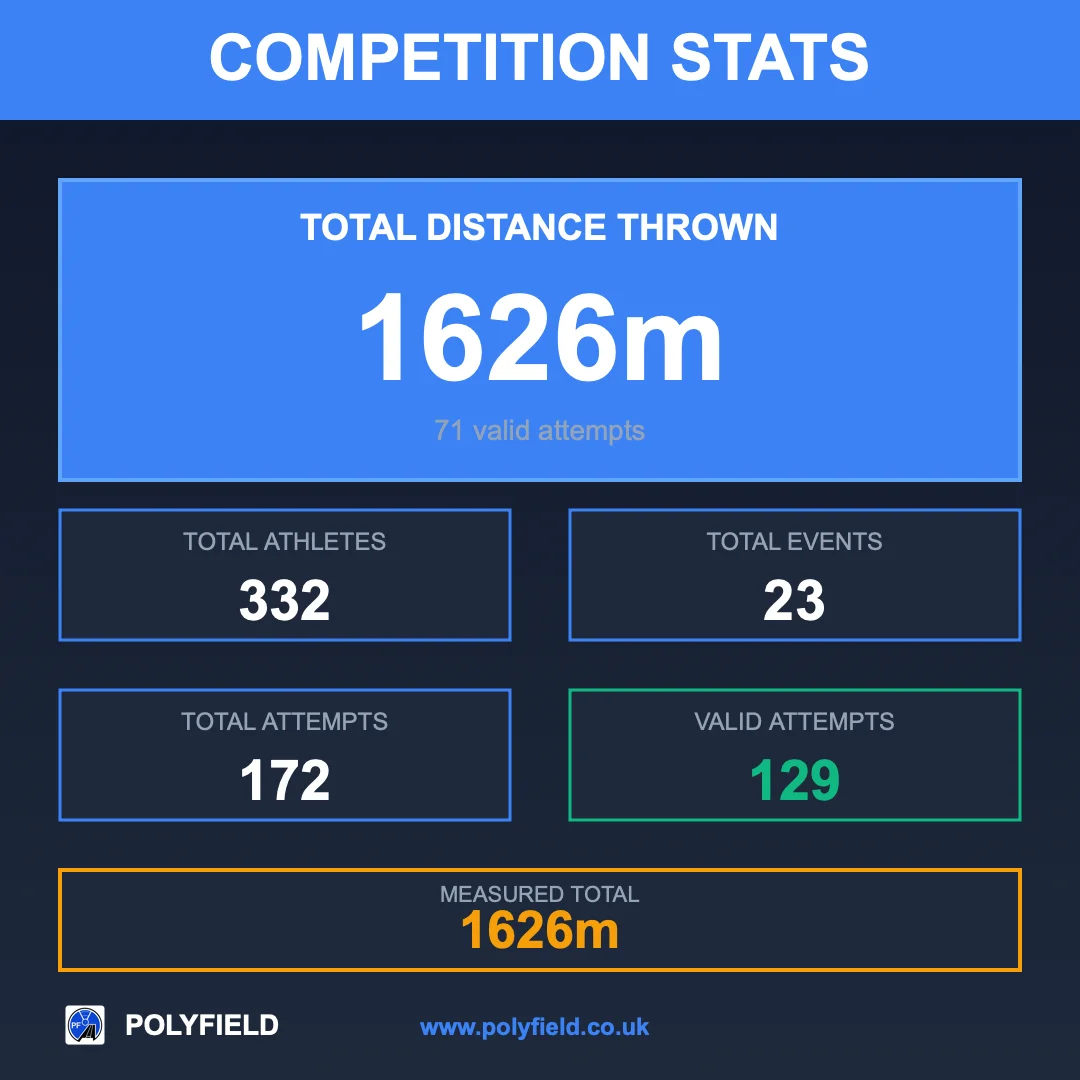
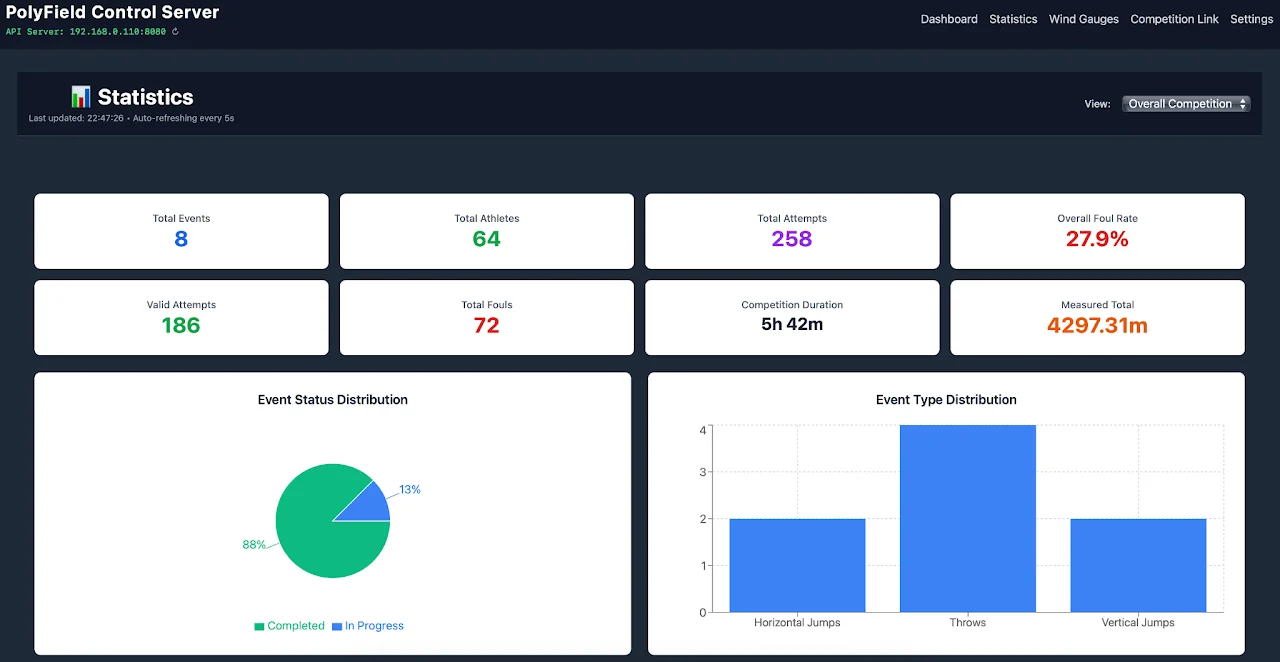
Whole-competition metrics
- Total number of events
- Total athletes competing
- Total attempts (jumps and throws)
- Overall foul rate (%)
- Total valid attempts
- Total foul attempts
- Competition duration
- Total measured (distance and height)
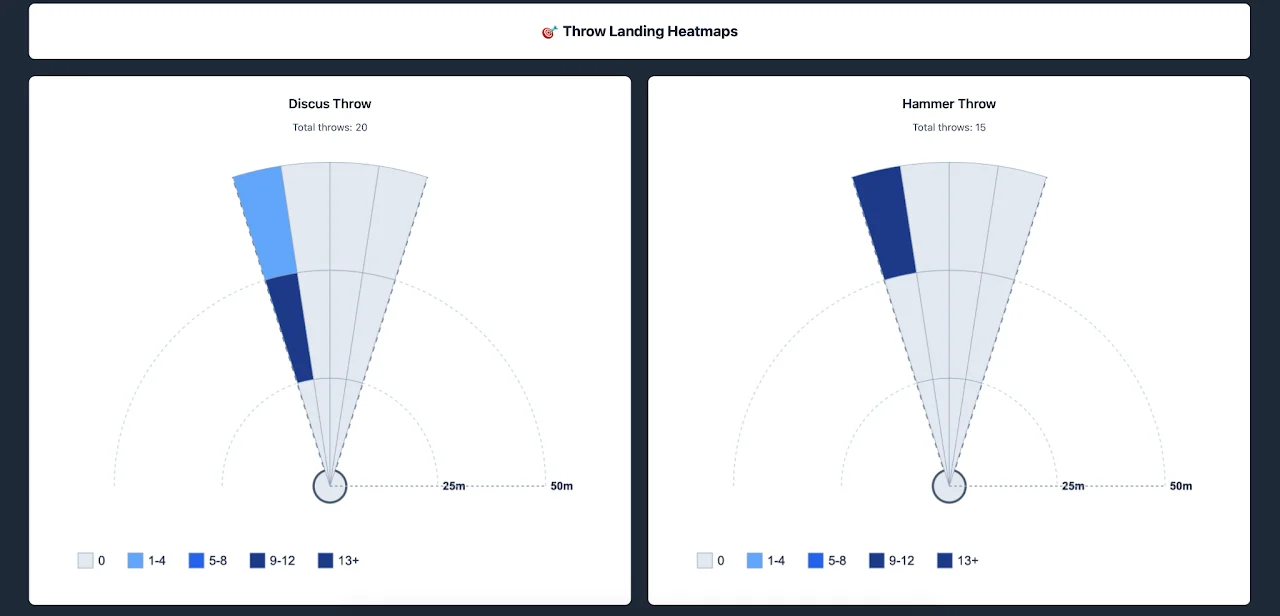
Throw landings
A heat map of each sector showing where throws most often land. Use it to position officials during competitions and, as data builds up, to improve officials' safety too.
Meets can publish heat maps to PolyField Results (a test feature), and OpenTrack will support them for meets run with PolyField.
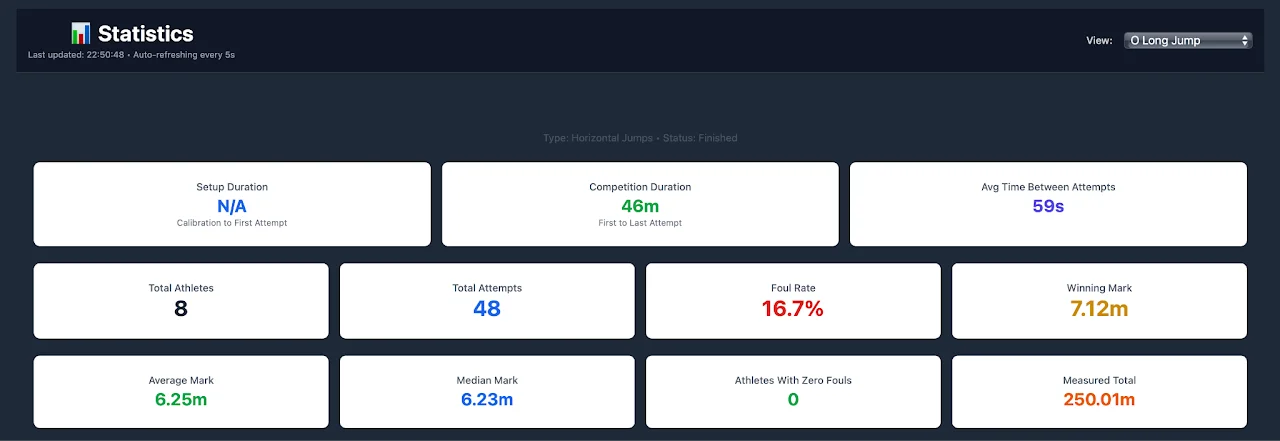
Event statistics
- Setup time (EDM calibration start to first attempt)
- Competition duration
- Average time between attempts
- Number of athletes
- Number of valid attempts
- Number of fouls
- Winning mark
- Average mark
- Median mark
- Athletes with zero fouls
- Total performances measured
- Landing pattern (left/right split, average landing angle)
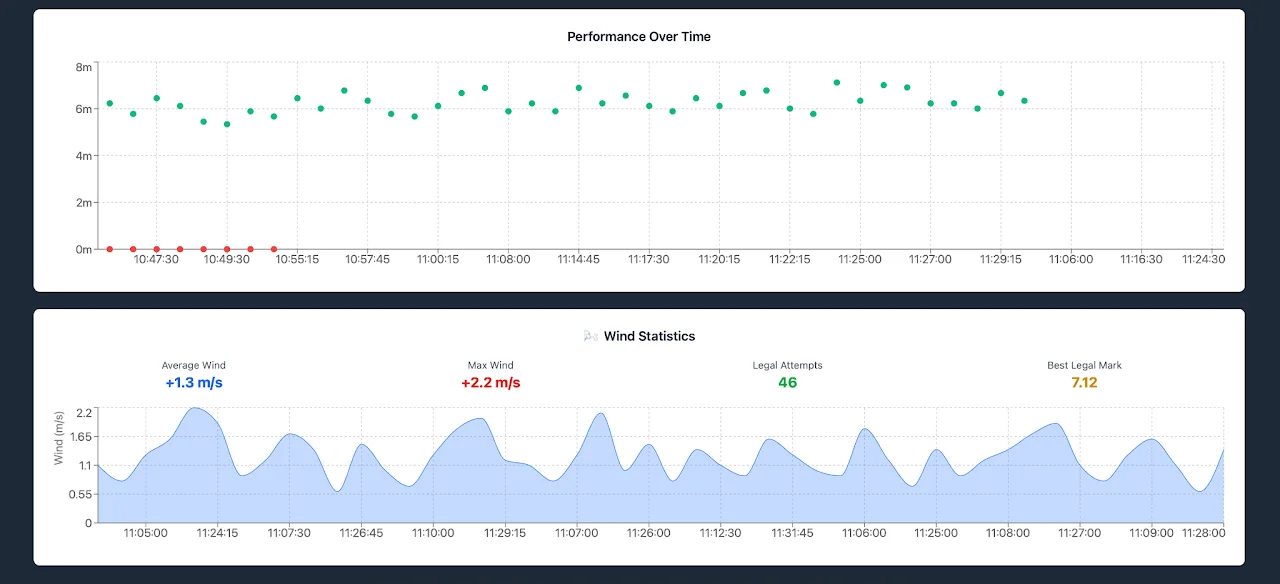
Event graphs and durations
- Performances over time
- Wind statistics, when a supported wind gauge is used
- How long each event ran from start to finish, to help with timetabling. Combine it with the number of athletes for richer planning data.
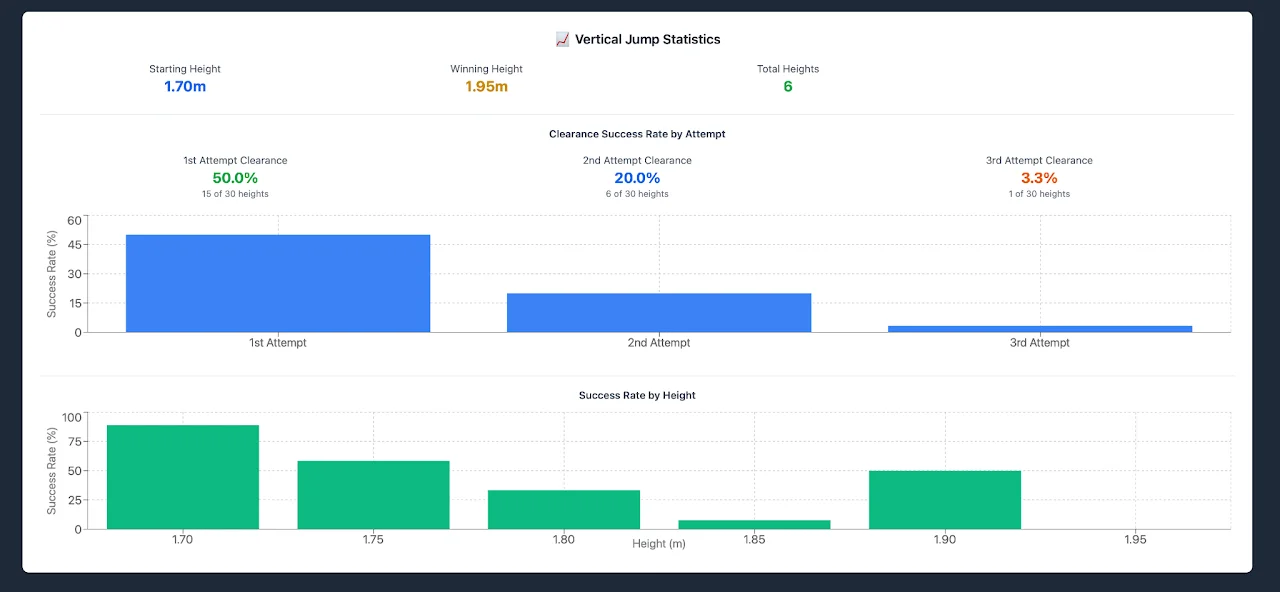
Vertical jump analysis
- Start height
- Winning height
- Number of heights
- Success rate per height
- Success rate per attempt (1st, 2nd or 3rd)
Share the moment
Social media exports
Square graphics ready to post to Instagram and Facebook, straight from the server.
-
Competition overview -
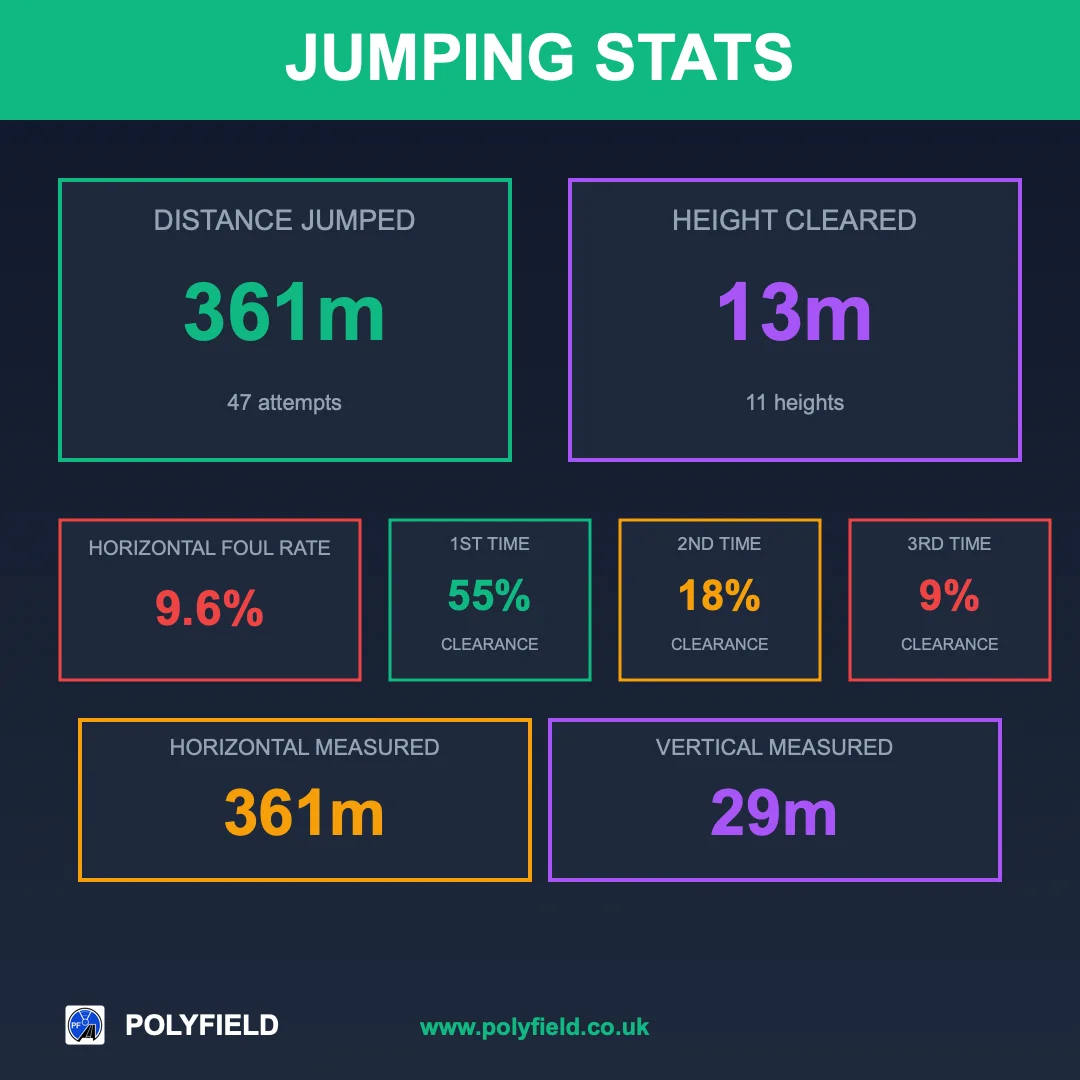
Jumps overview -
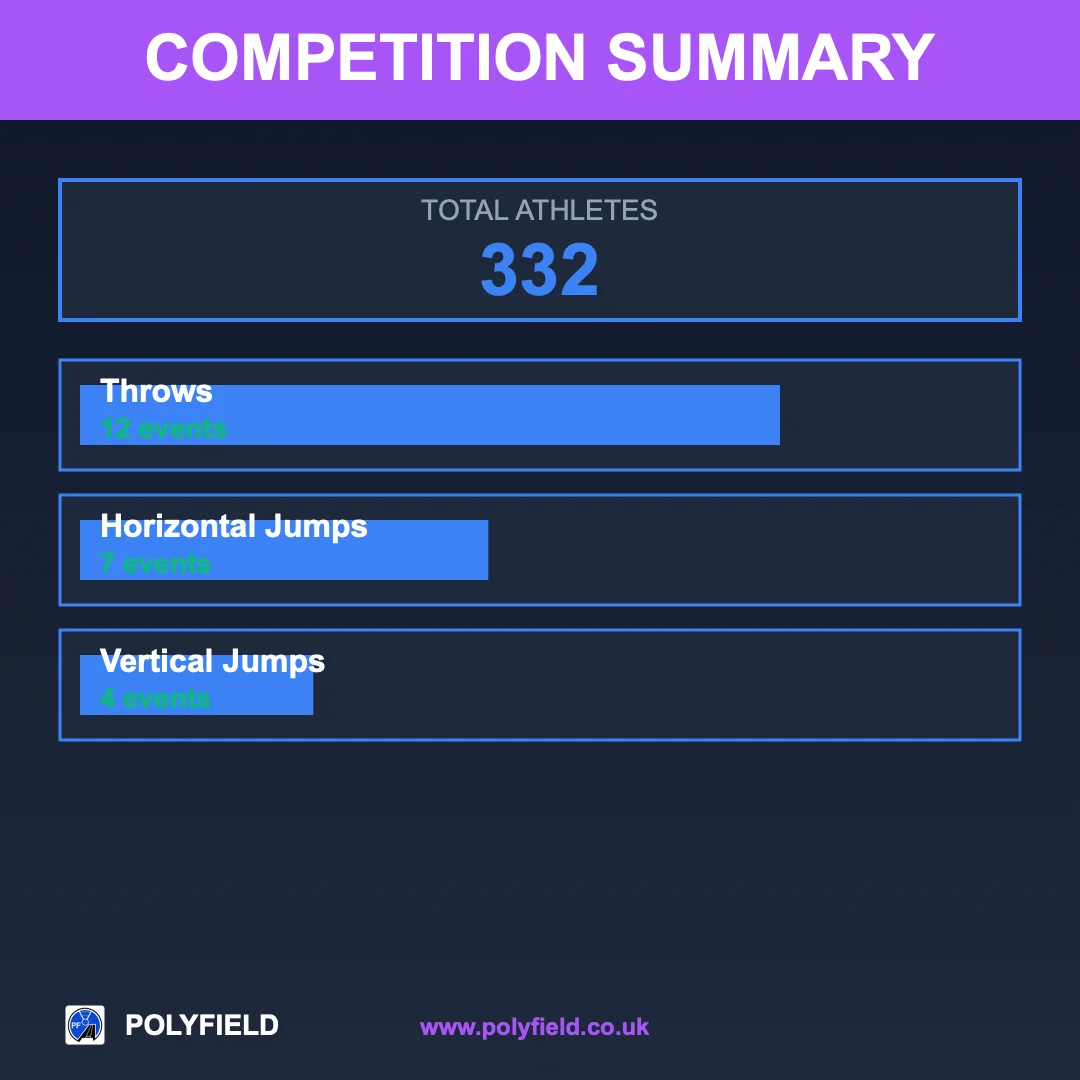
Competition summary -
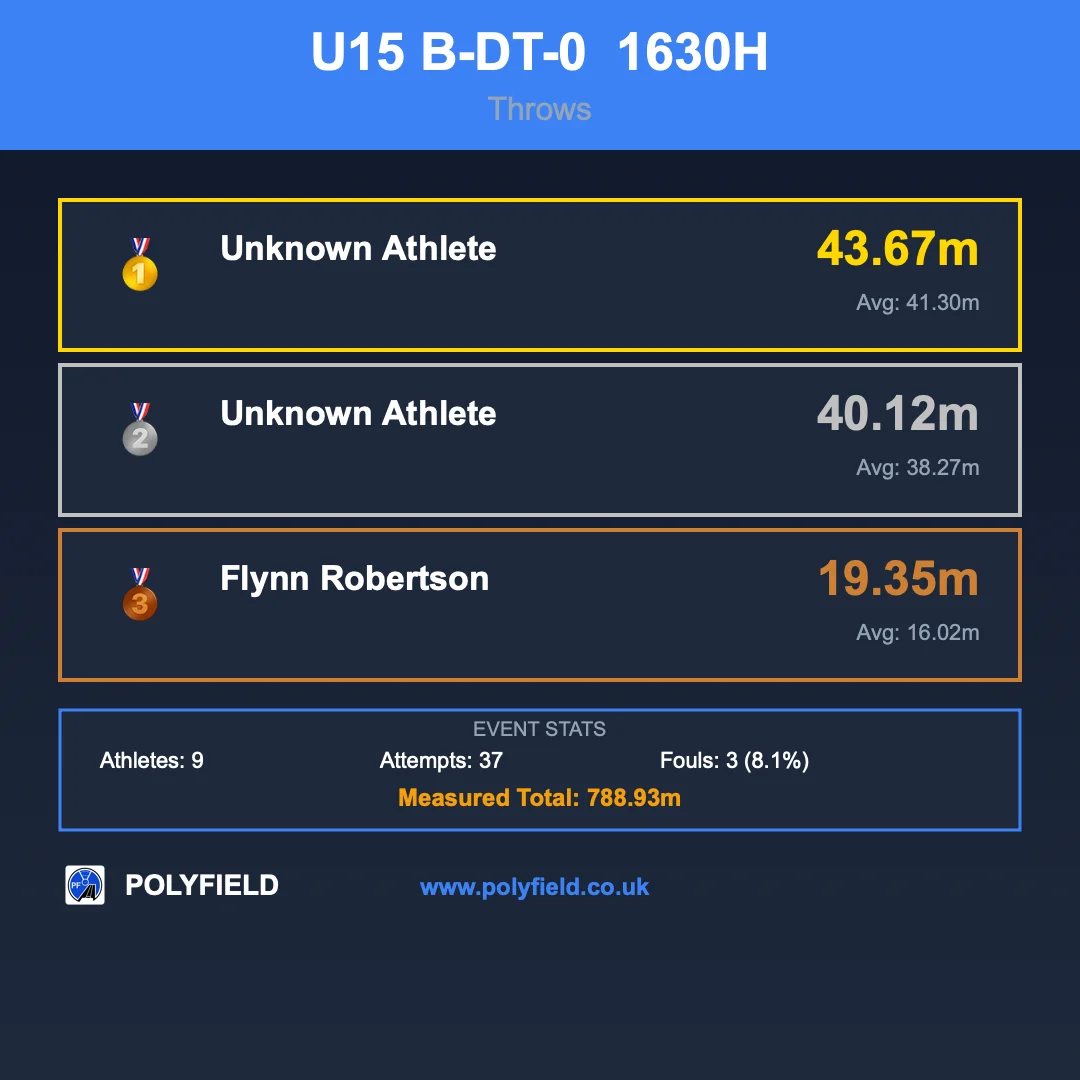
Throws event card -
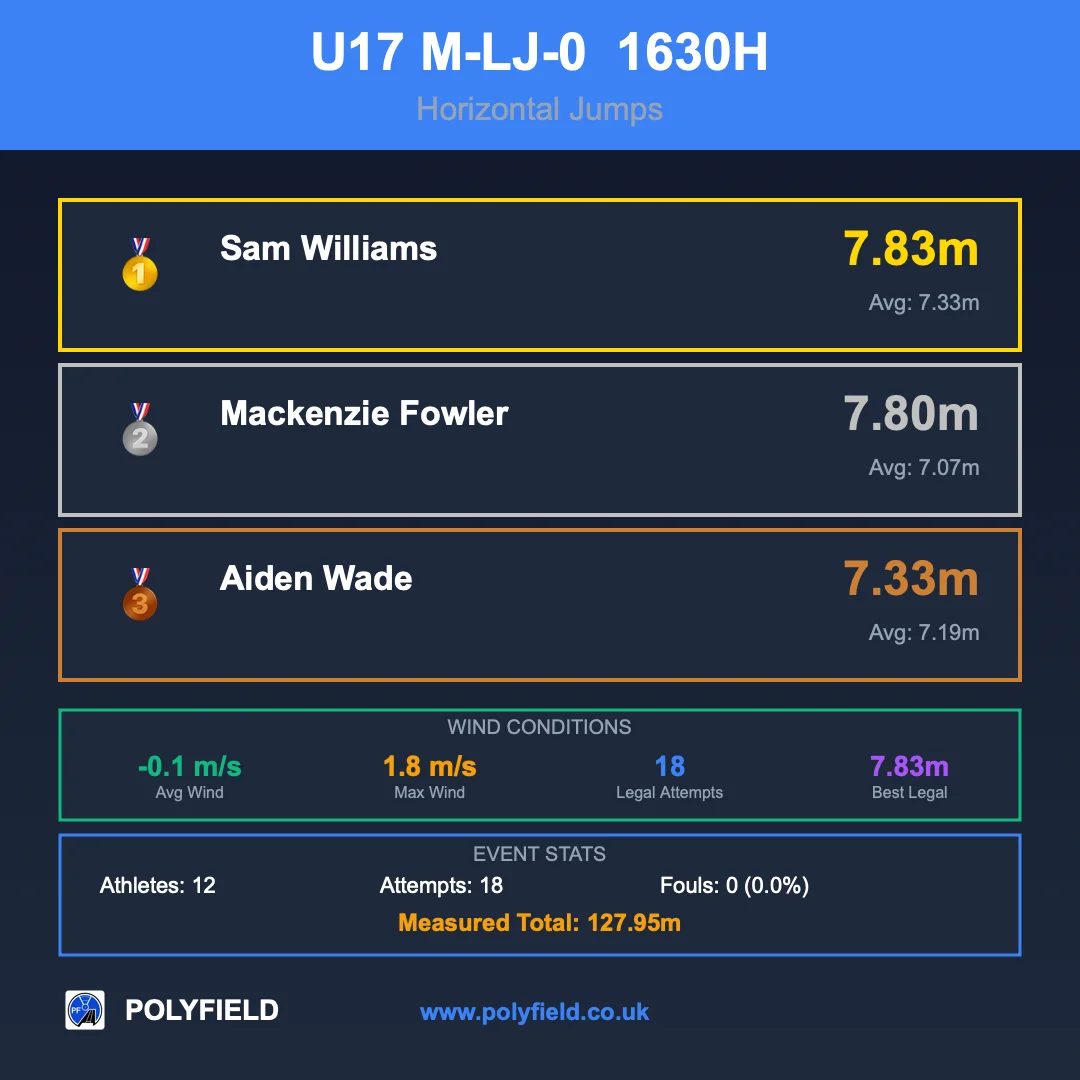
Horizontal jumps event card -
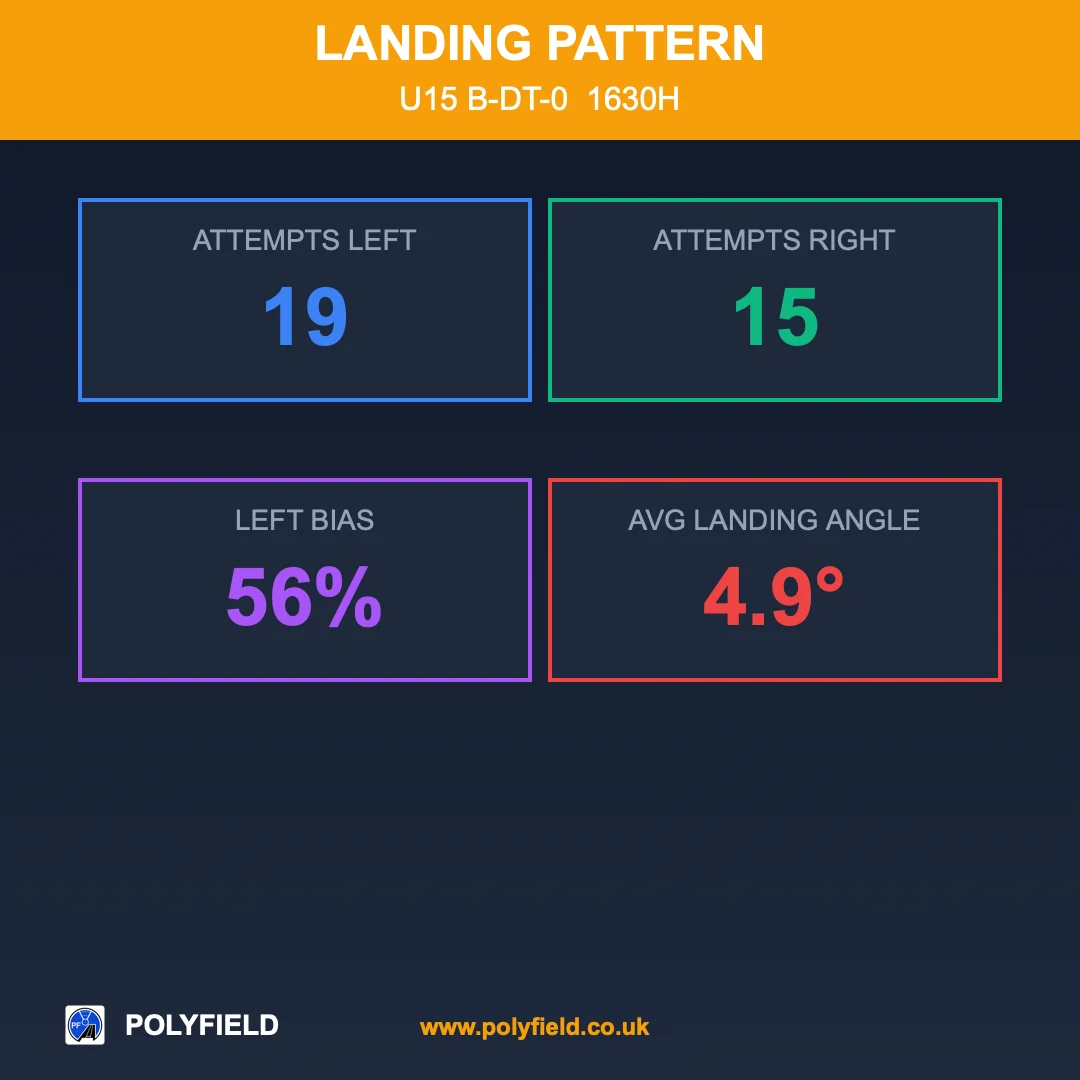
Throw landing pattern -
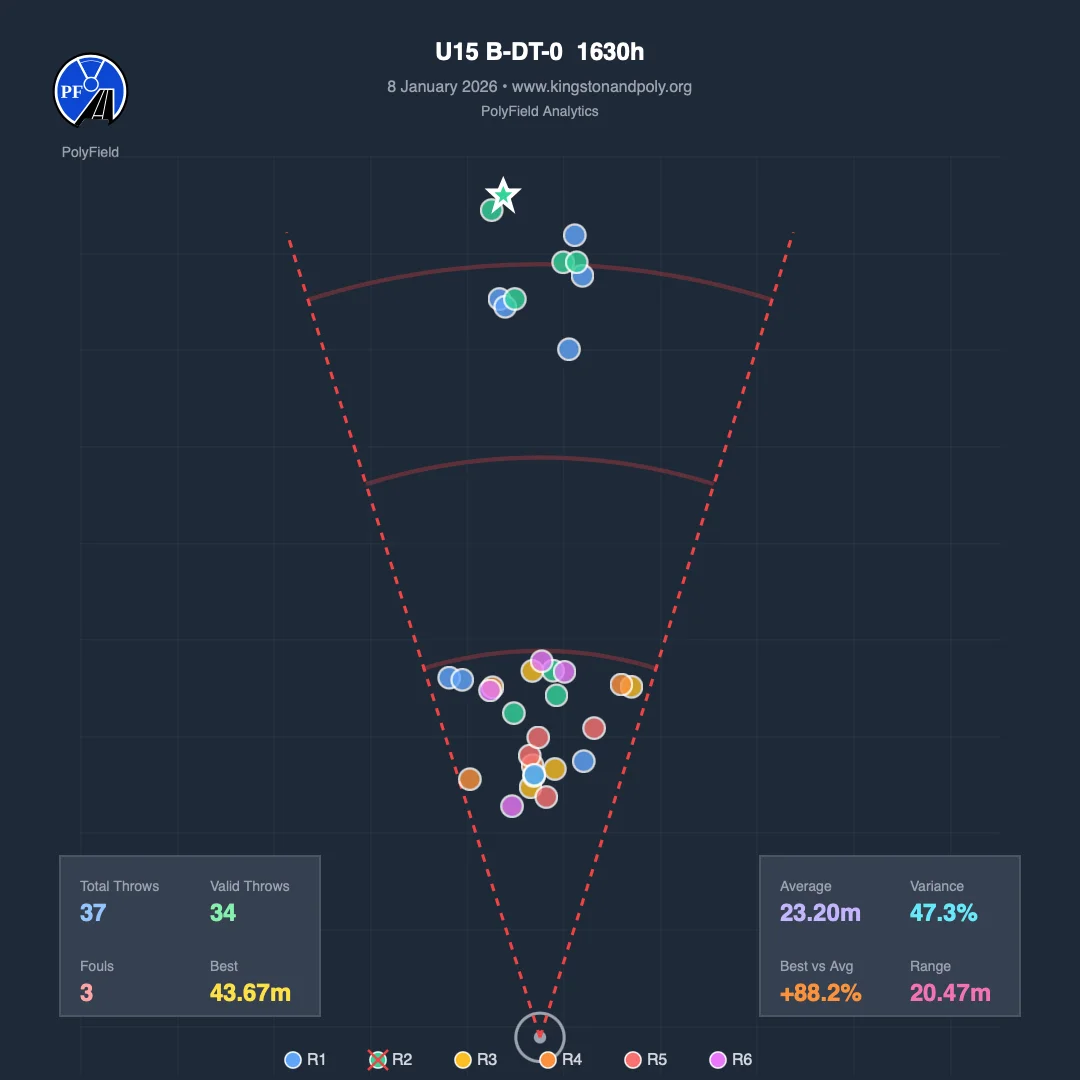
Event heat map -
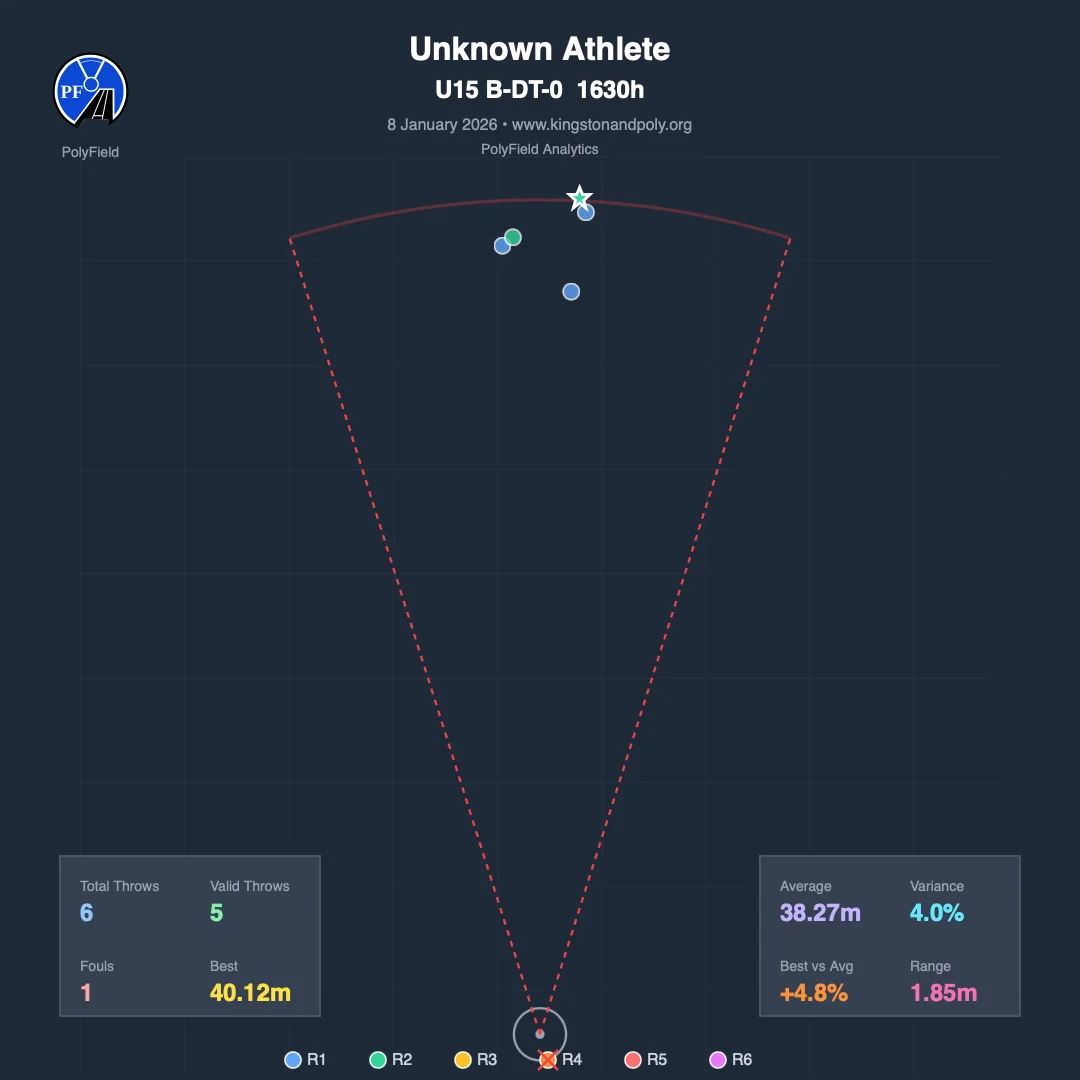
Athlete heat map -
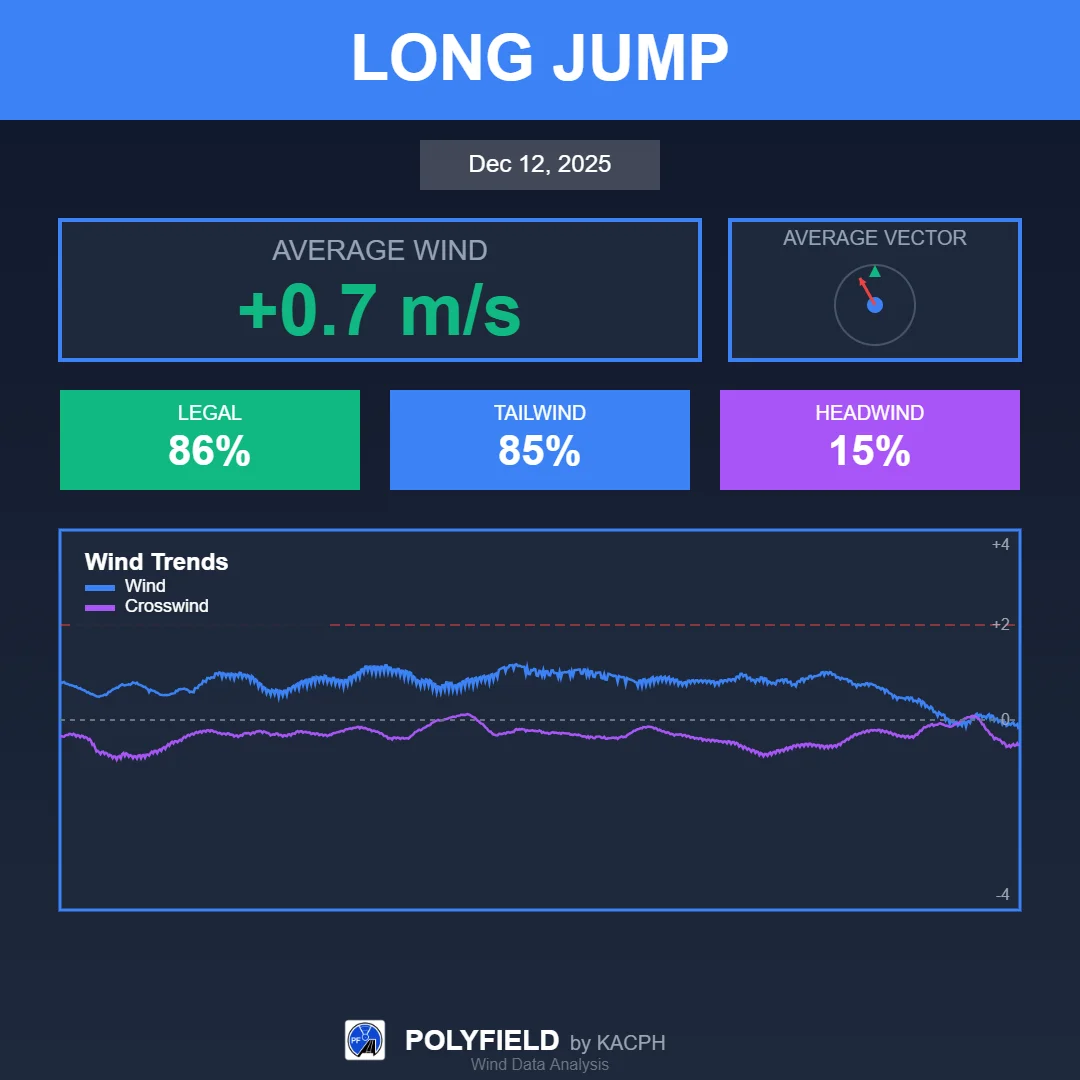
Wind summary
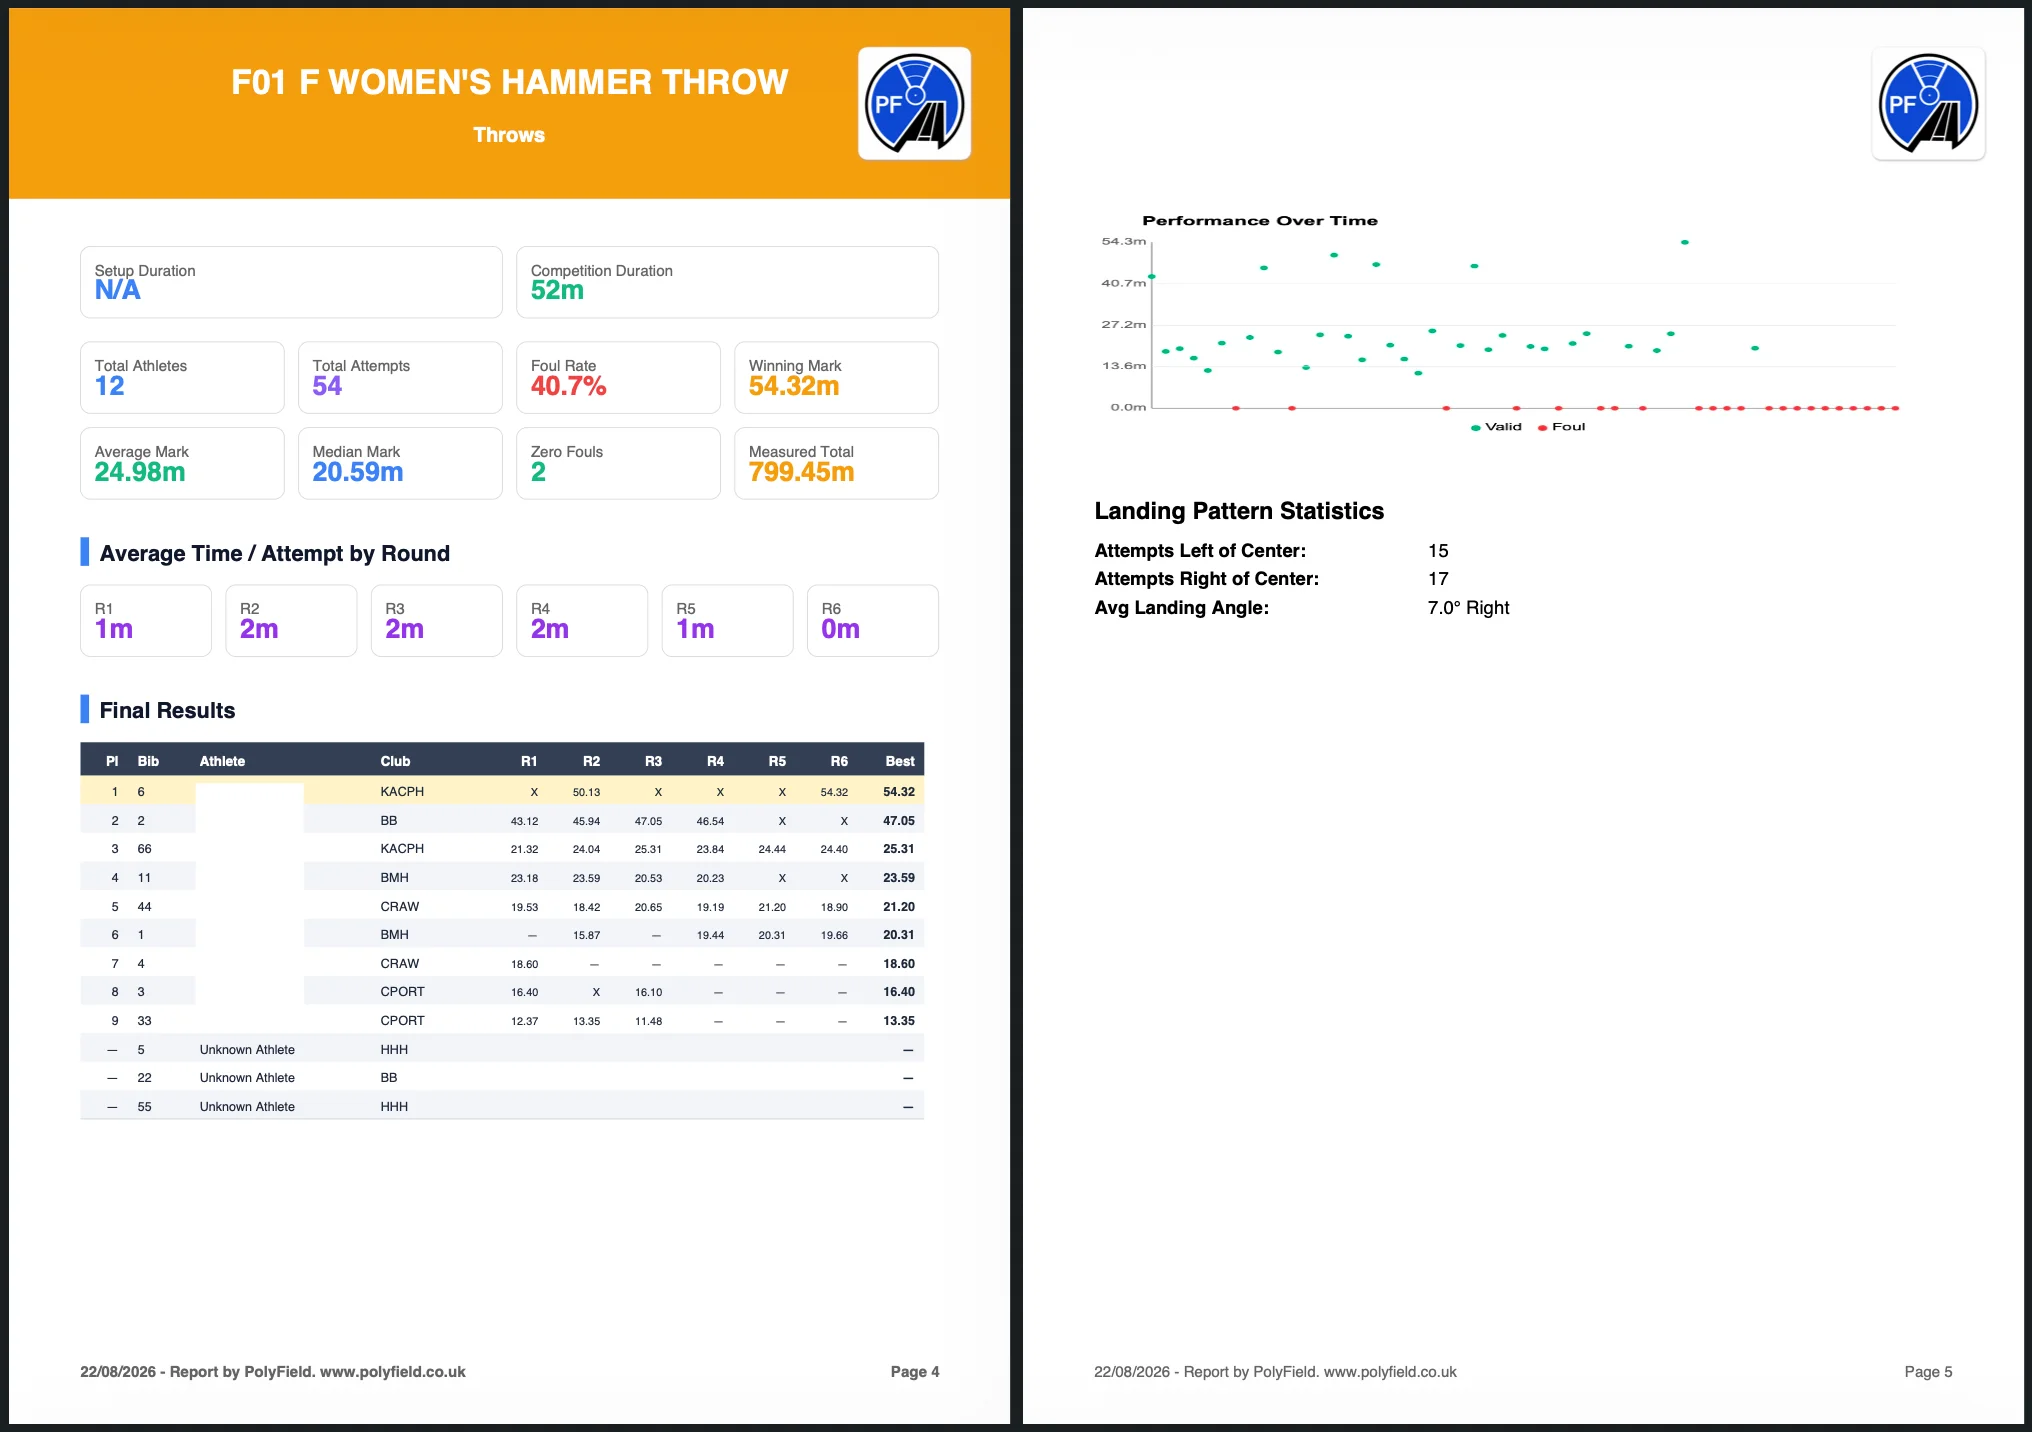
Export a PDF report
One click exports a full competition PDF with every chart, heat map and per-event summary, dated to the day of the competition.
Join the athletics tech revolution
Ready to stay ahead of your competition? Download the free App and get started.